Agentic chart building
Klaviyo
I led design of an AI chat tool that turns customers’ natural-language questions into custom data visualizations and dashboards, so each interface is shaped by the customer’s needs instead of a fixed template. Partnering with engineering, I defined the tools and skills the LLM uses to query customer data and generate charts with plain-language insights.
Read the full quote on LinkedInI had the pleasure of working with Stephanie in the Reporting & Analytics team at Klaviyo. As an engineer implementing her work, I found Stephanie’s designs to be thoughtful, creative, and comprehensive...
The problem
Customers wanted more flexibility and insight into their data but the dashboard page was bogged down by dense reports that cluttered the page and limited ways of organizing the dashboard in a way that was most important to them.
- Customers struggled to answer their specific questions in a sea of data-heavy reporting surfaces
- Customers wanted more control over what pieces of their data were most important to them in that moment
- Customers struggled to understand the why behind the data, and what to do next to make improvements
Klaviyo’s old dashboard experience with limited ways to customize and organize dashboards.
Measuring success
Our goal
- Help customers quickly get to specific answers in their data
- Provide insights into the why behind their data
- Customers can save their data to a dashboard that they can revisit and share
The vision
Designed a mid-fi prototype using V0 to get feedback on the longer term vision. Here are some key themes:
Ask questions of your data in plain language
Customers build a dashboard by asking a question in plain language instead of setting up reports by hand.
A canvas that fits how you work
The dashboard is a flexible canvas that lets you drag, resize and rearrange charts around your own priorities, and the layout holds its shape as the screen changes.
From insight to action
Your data doesn’t stop at an answer, it provides deeper insight and suggests ways of making incremental improvements based on the data.
V0 vision prototype used for early conversations about the vision and direction.
The planning
I led the planning of the roadmap for this project by working with engineering, product leadership and design leadership to determine incremental milestones.
- Met with senior leadership across design, product and engineering to align on strategy and roadmap
- Held weekly meetings with the team to keep the plan on track and realign based on customer and stakeholder feedback
The design
We started with opening up our database to Composer, our chat based experience, which unlocked the ability for customers to ask questions of their data that otherwise would have been challenging to extract from the product.
First milestone
We then iterated rapidly to improve the chat experience from a block of text, to a structured hierarchy of text to a visual representation of the data.
We started with a scrappy version that could access our data so customers could ask specific questions.
Image 1 of 3: Composer responding to a question with a block of text.
Second milestone
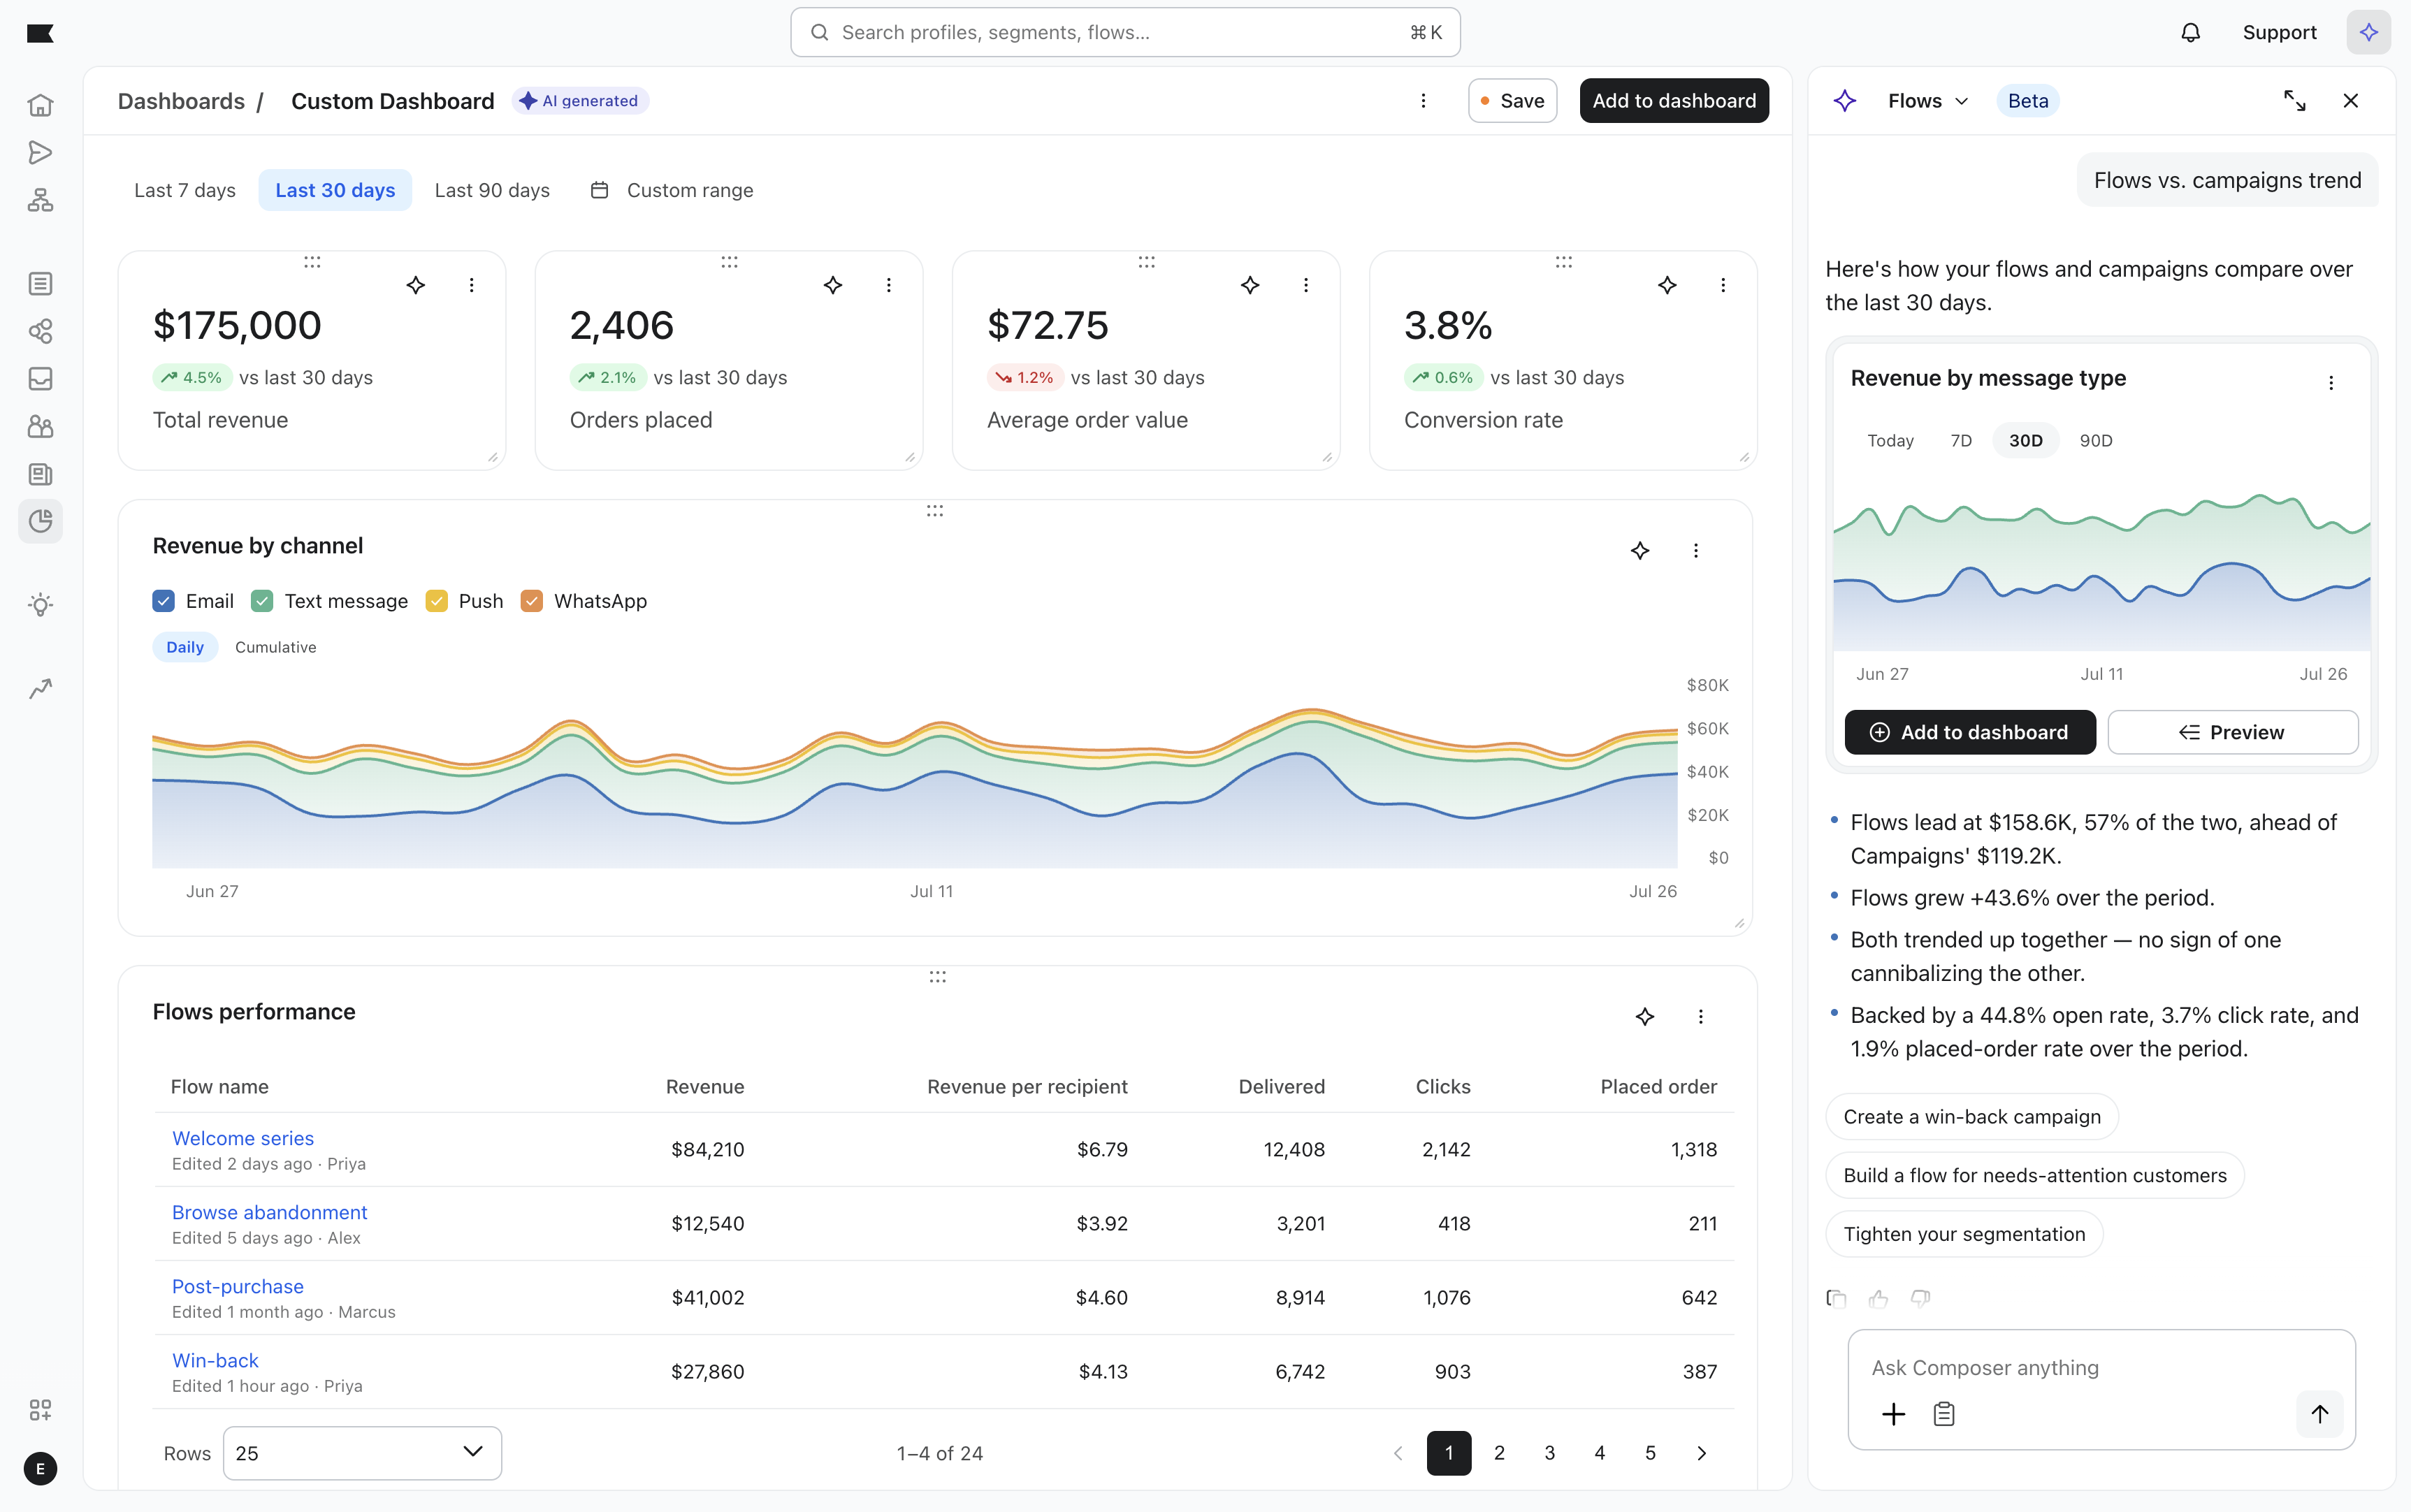
While we were iterating on the chat experience, we started building out the ability to pin and save data visualizations to a new flexible version of the dashboard. Customers now arrange their dashboards to their own mental model by dragging, resizing and rearranging data.
Flexible new dashboard that is not limited by prebuilt widgets, allowing customers to get at specific questions, pin them to a dashboard and customize the dashboard to their mental model.
Partnering with engineering
I ran weekly QA sessions with a cross-functional group of design, engineers and project managers to rapidly test and iterate on improvements.
Provided detailed design feedback to ensure a high quality final product.
Design feedback on the working build, covering layout, responsiveness, and chart labels.
Code contributions
While working on this project, I made a few contributions to the code including updating our component library components using Cursor and partnering with engineers to make sure the code met our team’s standards.
This included adding a visual gradient to our area chart components, updating stacked area charts to stacked line charts for time series and supporting animation updates to our legend filtering transitions.
Contributing to the production code, before and after switching stacked bar charts on a time series to a stacked area chart.
Image 1 of 3: Omnichannel attribution chart and table, with a cursor hovering the Active on site column.
The event
Klaviyo hosts a big product launch and roadmap event every year for their customers and partners. This project was featured as a part of the Composer agents data platform capabilities. I put together a demo walkthrough of the features my engineering team and I worked on.