Ascent Design Systems
Klaviyo
As one of the founding designers on Klaviyo’s Design System team, I led the creation and evolution of a Data Visualization library that now powers analytics experiences across the platform. My work focused on enabling a team of 50+ product designers to build consistent and meaningful data experiences.
50+
designersSupported across 8 pillars
20+
componentsdesigned with continued iteration
100+
office hoursSupported across 8 pillars
The problem
As the platform scaled and the company went through a large rebrand, it was critical for the product to establish reusable scalable components and patterns to improve usability, establish trust in our data, and improve both design and engineerings speed.
- Patterns and visuals were inconsistent and at times outdated or broken
- Design and engineering often rebuilt similar solutions
- Accessibility issues in color usage and chart affordances
- Constrained to a pre-built charting library that didn’t meet growing needs
My role
Senior Product Designer (Design Systems)
Cross functional team
Component Library Engineers, Product designers across the product pillars, Product Managers, Product Engineers
Klaviyo before the Ascent Design System and company rebrand.
Image 1 of 3: Earlier Klaviyo campaign report with an area chart of opens and clicks above campaign stats.
Discovery & roadmap
I did iterative rounds of discovery through auditing the data experience across the entire product. Met with designers, product managers, engineers and customers to help uncover:
- Gaps in chart types and interactions
- Inconsistent patterns and behaviors across similar data experiences
- Opportunities to standardize without limiting product expression
I owned the roadmap and planning for each component and feature release, working with the product teams to align with their teams' roadmaps.
Design process
My process involved collaboration, detailed design, documentation and mentorship to ensure I was designing components that were consistent but scaled well.
- Meet with the users and product teams to understand the needs
- Competitive research
- Design iteration and feedback sessions
- Detailed technical specs for engineering to build the component with variants and prop considerations
- Final Figma component for designers to quickly prototype consistent designs
- Detailed documentation for product teams to reference on component usage and best practices
Chart legend filtering
Chart filtering was inconsistent across the product, with dropdown menus blocking the data and duplicating legend content, which made for a poor user experience.
I started with ideation research on interaction patterns for chart legend filtering and then held feedback sessions for design iterations.
Ideation research on interaction patterns for chart legend filtering.
Image 1 of 2: Competitive analysis of chart filtering patterns.
Usability research
When stakeholders disagreed on which interaction would be best for the customer, I used usability testing to advocate for the interaction pattern that improved clarity, accessibility, and overall experience.
Final design
The final design simplifies the chart filtering interaction into a single pattern that is scalable across the product. After completing this design I worked across the product teams to update this pattern within the product.
Image 1 of 3: Before and after of chart filtering on a deliverability chart.
Design spec
For each component I created detailed design specs that defined the visual details and behaviors required to scale the components. Including:
- The purpose of the component
- Token usage - colors, fonts, spacing, etc.
- States - entry, empty, loading, data density, etc.
- Accessibility - color, font, keyboard interactions
- Figma component used by all the designers to create their designs
Documentation
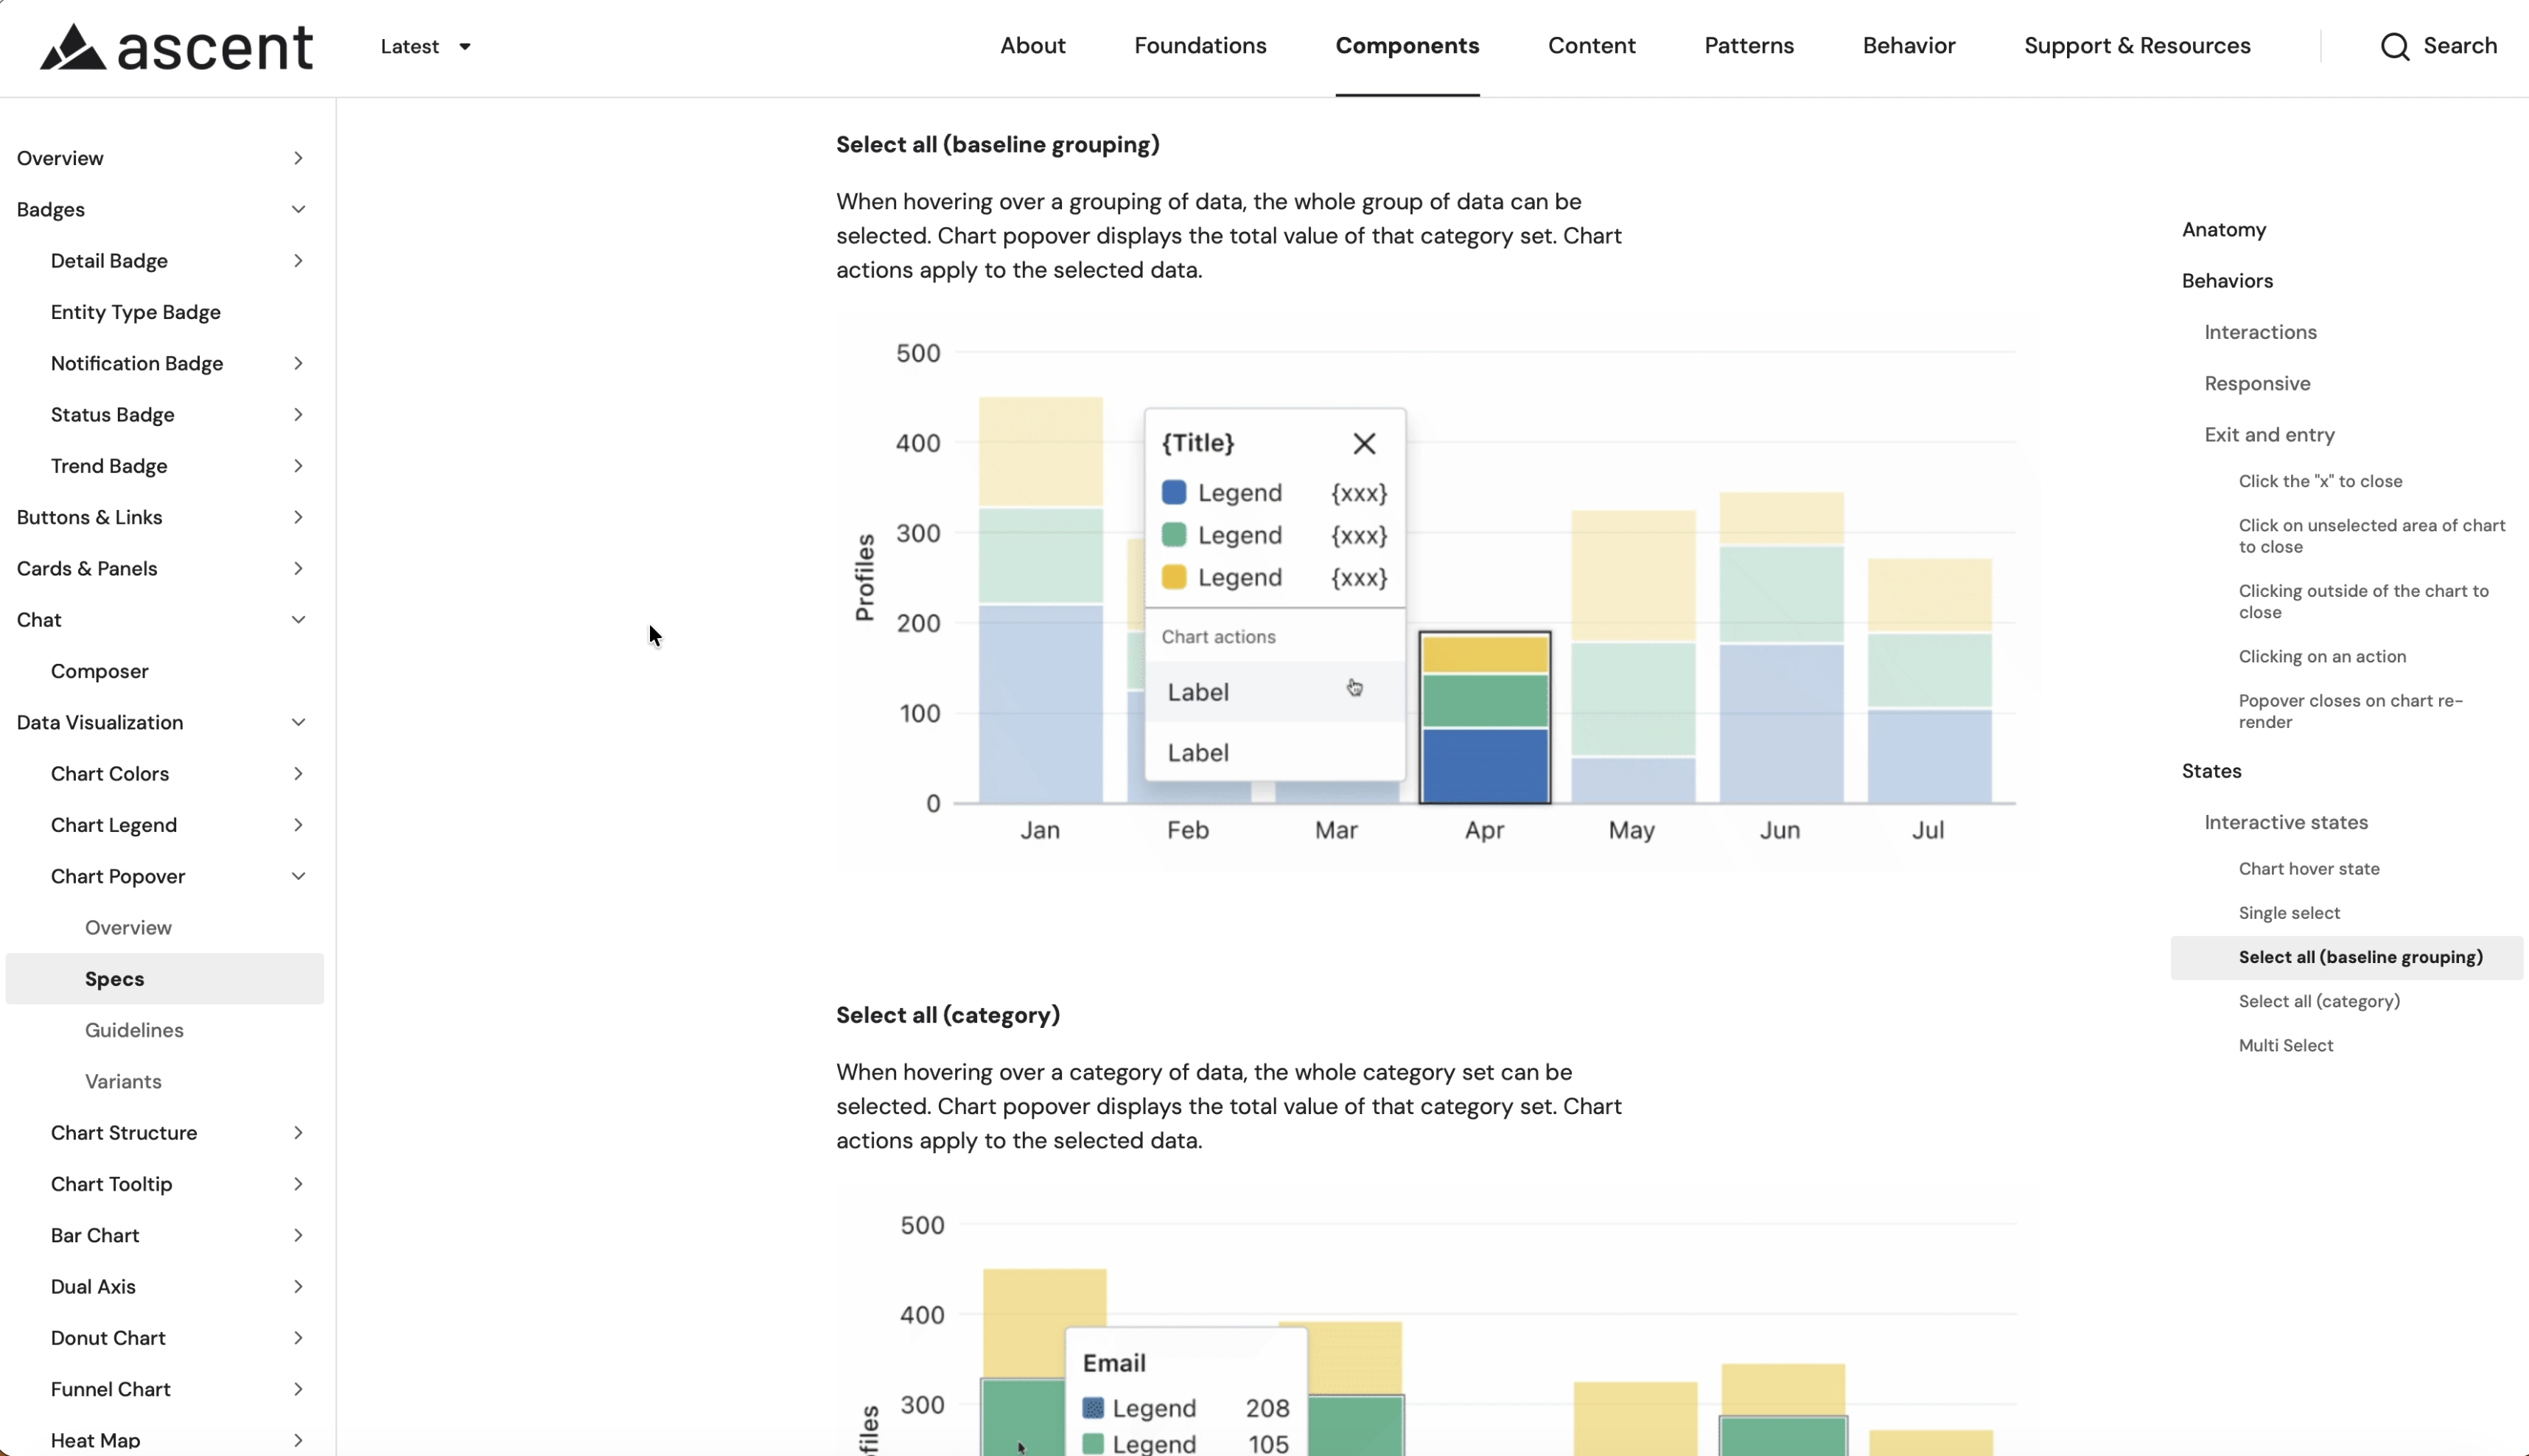
Created documentation for every component as a reference and guideline for Product Designers, Product Engineers, and Project Managers
- Anatomy of the component
- Behaviors
- Variants
- Patterns
- Do’s and don’ts on how to use it in the product
- Content
- Accessibility
Measuring success
Driving adoption and tracking the success of the components across the product was an important part of our team’s process. We measured success through:
- Weekly office hours feedback
- Usability testing with customers
- Customer support tickets
- Design system feedback form
- Design system request form
100%
Product team adoptionAll product teams actively used Ascent components in 2025.
8.8/10
satisfactionUp from 7.1/10 in early 2024.
+24%
Satisfaction improvementRelative increase from early 2024 through late 2025.
Pillar team support
For larger efforts, I would embed onto pillar teams to dive deep into a new feature or problem space. I partnered with the analytics product team to bring systems-level thinking and data visualization best practices to a net-new RFM analytics experience.
The problem
Customers had data that lived in spreadsheets and disconnected metrics, so they struggled to prioritize who to target, see how engagement changed over time, or decide what to do next.
Competitive analysis and ideation research for illustrating RFM data.
After aligning with the Product Pillar Triad on goals, constraints, and success metrics, and building on early research from the PM and Pillar Designer, I focused on visualizing customer data as movement and progression. The designs unified fragmented data into clear visuals, revealed risk and opportunity between segments, and let marketers trigger campaigns and flows directly from what they saw, turning analytics into a decision engine.
Design iterations for RFM analysis.
Key insights into my role
- Advocated for action in GA scope: When time and technical constraints put “taking action on data” at risk of being cut, I pushed to keep it, arguing that users couldn’t realize the full value of the journey insights without the ability to act on them.
- Chose chart types intentionally: Sankey charts make movement between segments visible, so drop-off and recovery patterns read as a clear visual narrative. Funnel charts clarify step-by-step lifecycle progression and pinpoint exactly where drop-off occurs.
- Reduced cognitive load: Together, the two visualizations help users understand what’s happening and confidently decide which customer segments to target.
Customer success stories
$6.5K
incremental revenueRuffwear, from RFM-triggered retention flows in month one
2x+
win-back revenueTibi’s top RFM-triggered win-back flows vs. its prior flow, in the first month
61%
ROAS growth2xist’s YoY Facebook ROAS with RFM-based audiences